Fourteen signals, one clock
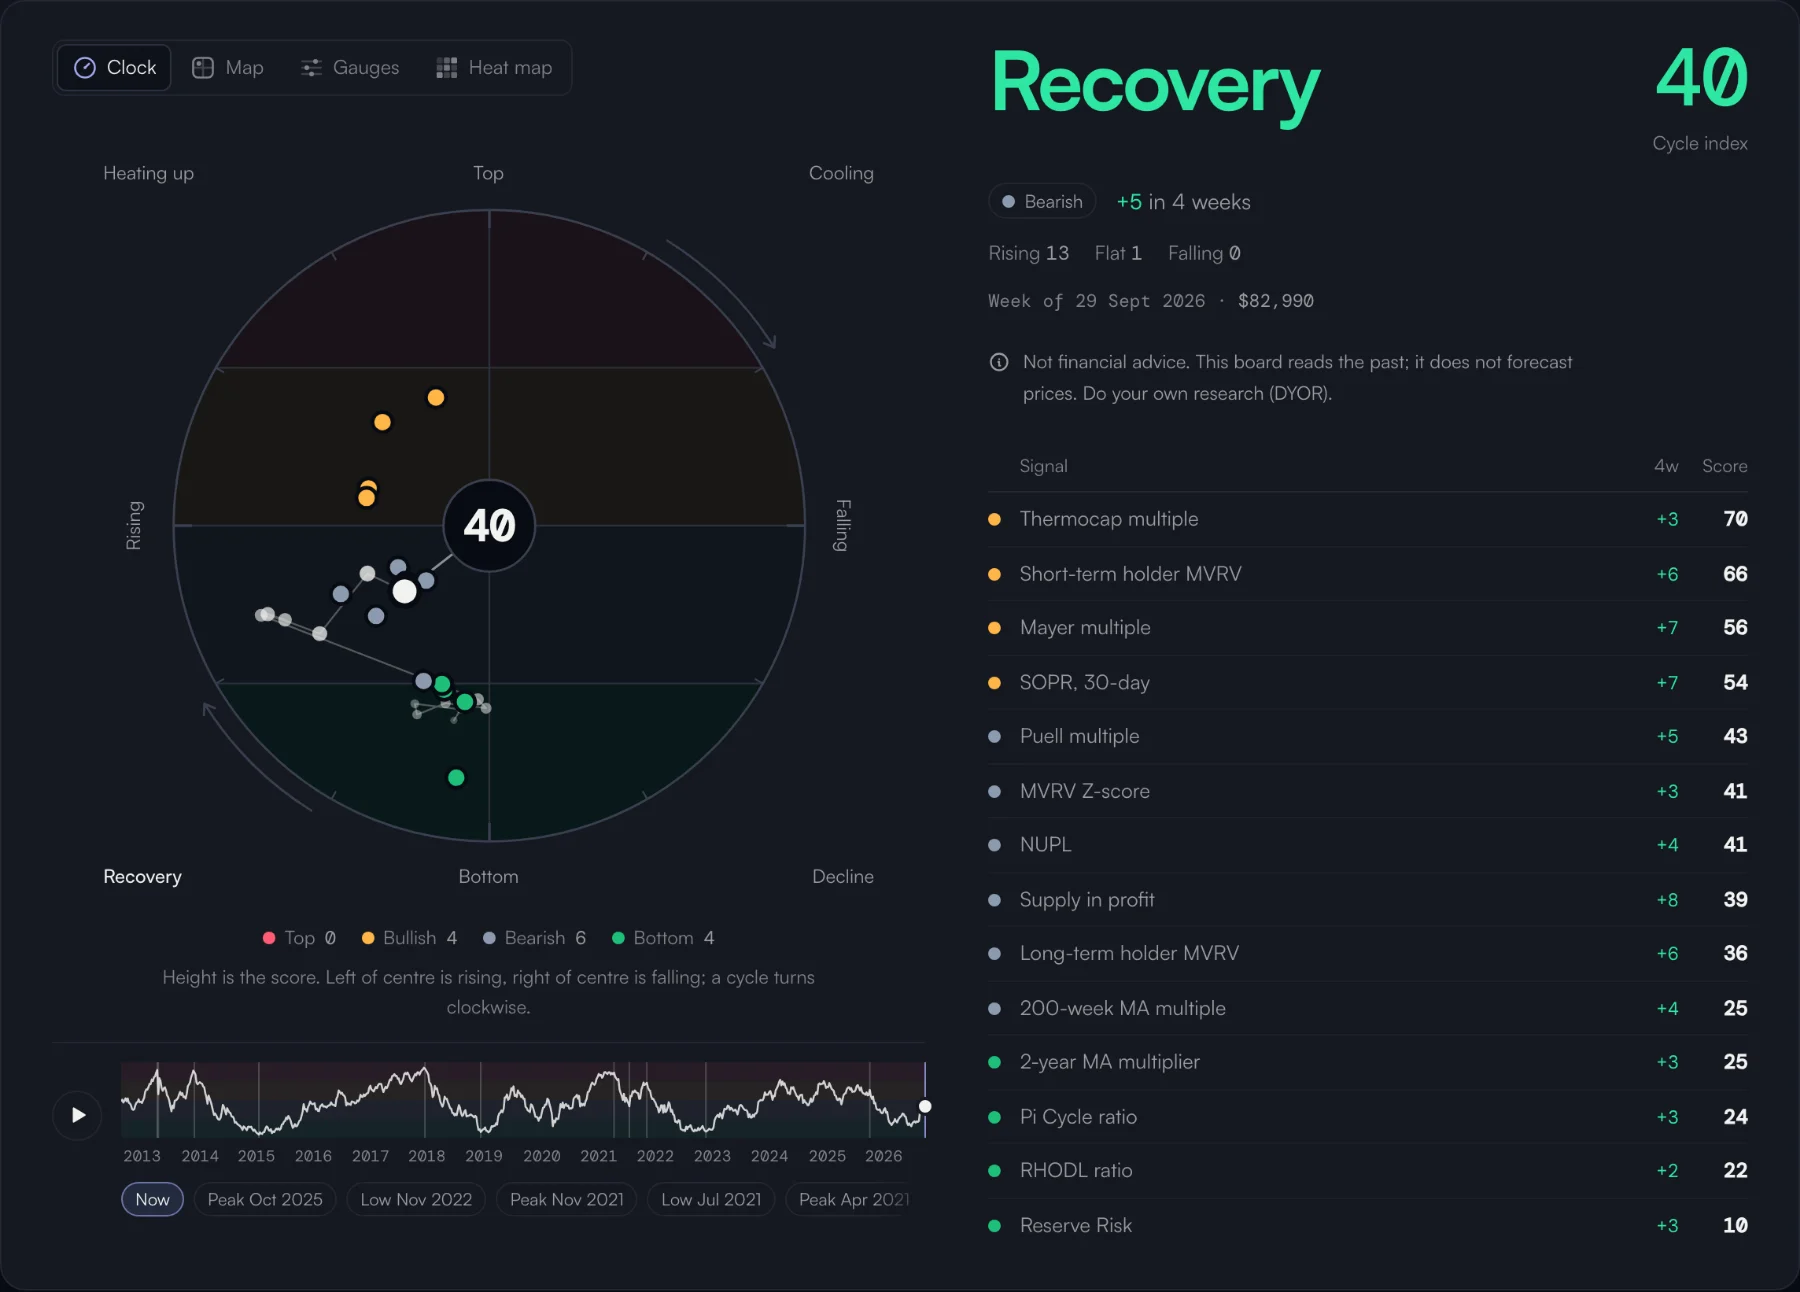
Cycle metrics from on-chain data and from the price's own history, each scored 0–100 against its past and placed on a dial by its level and its four-week move.
Perly Charts
Price, cycle, on-chain, institutions, altcoins, stablecoins and the dollar — over seventy charts computed from public data, each set against its own past. Free, with nothing to sign up for.
State of the market
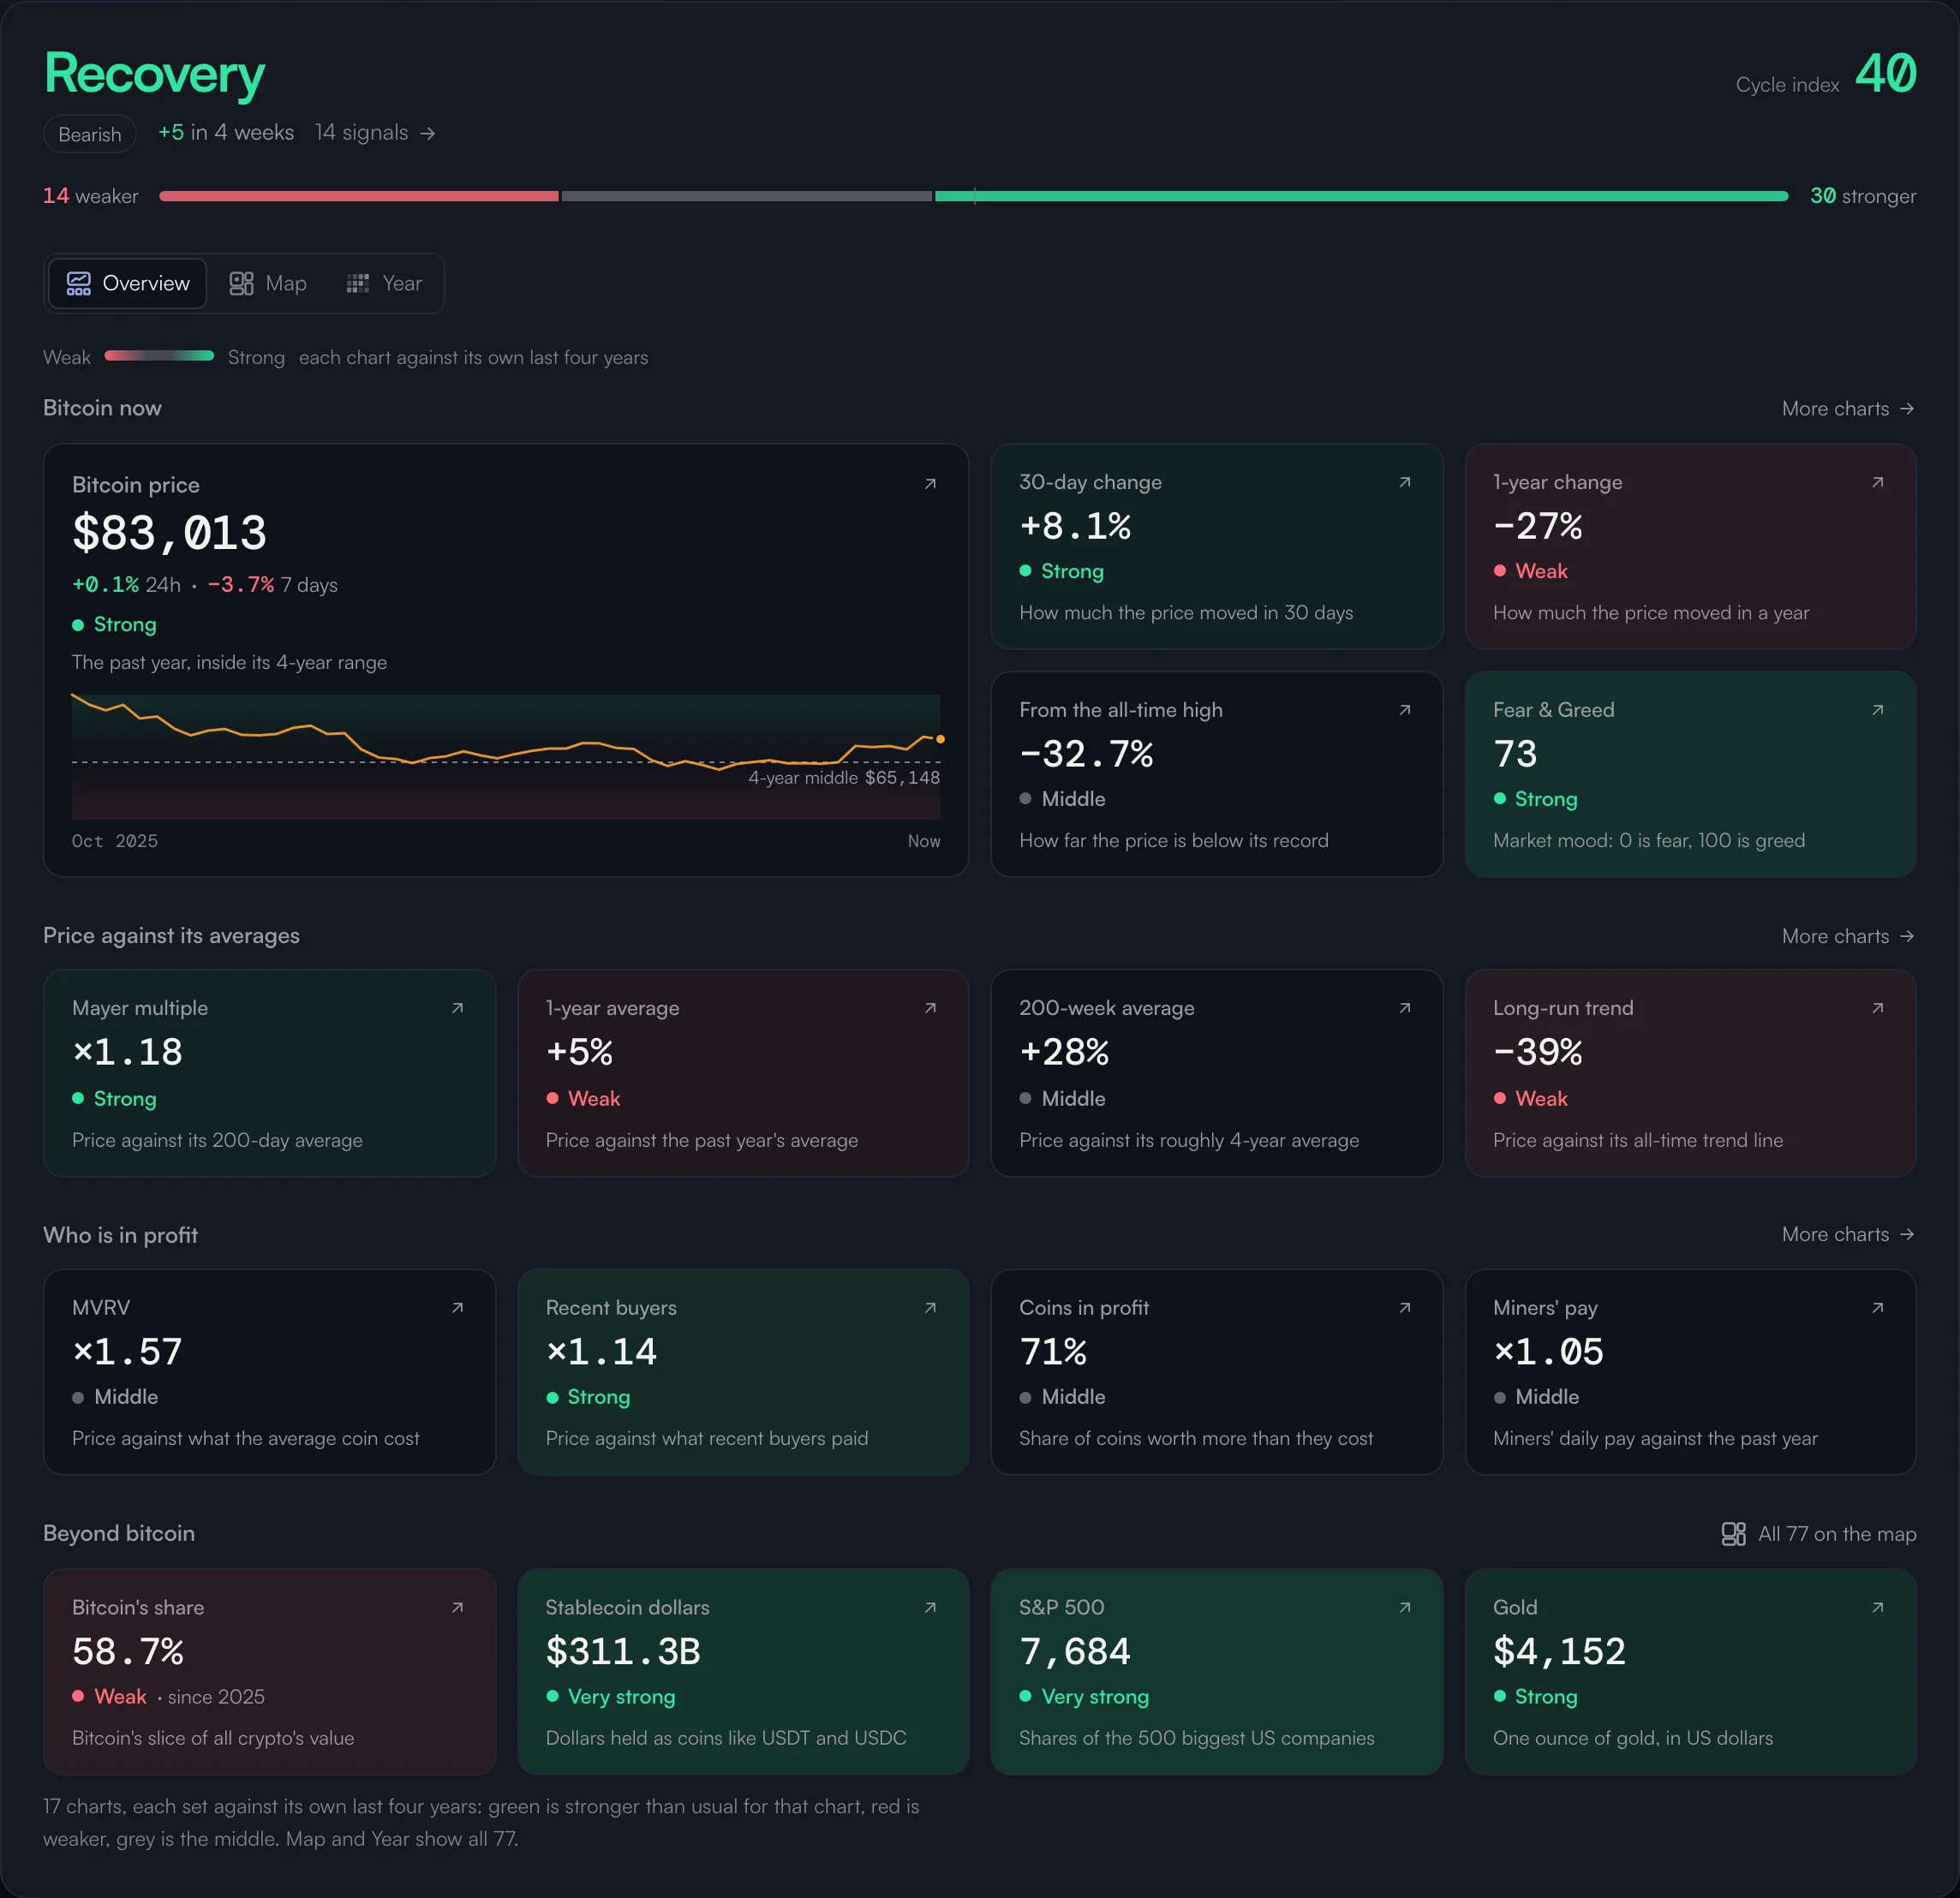
The board opens with where the cycle stands, in plain words, and then sets every chart on the site against its own last four years.
The cycle's verdict, then the charts that matter most, each in its own cell: green where it is strong, red where it is weak.
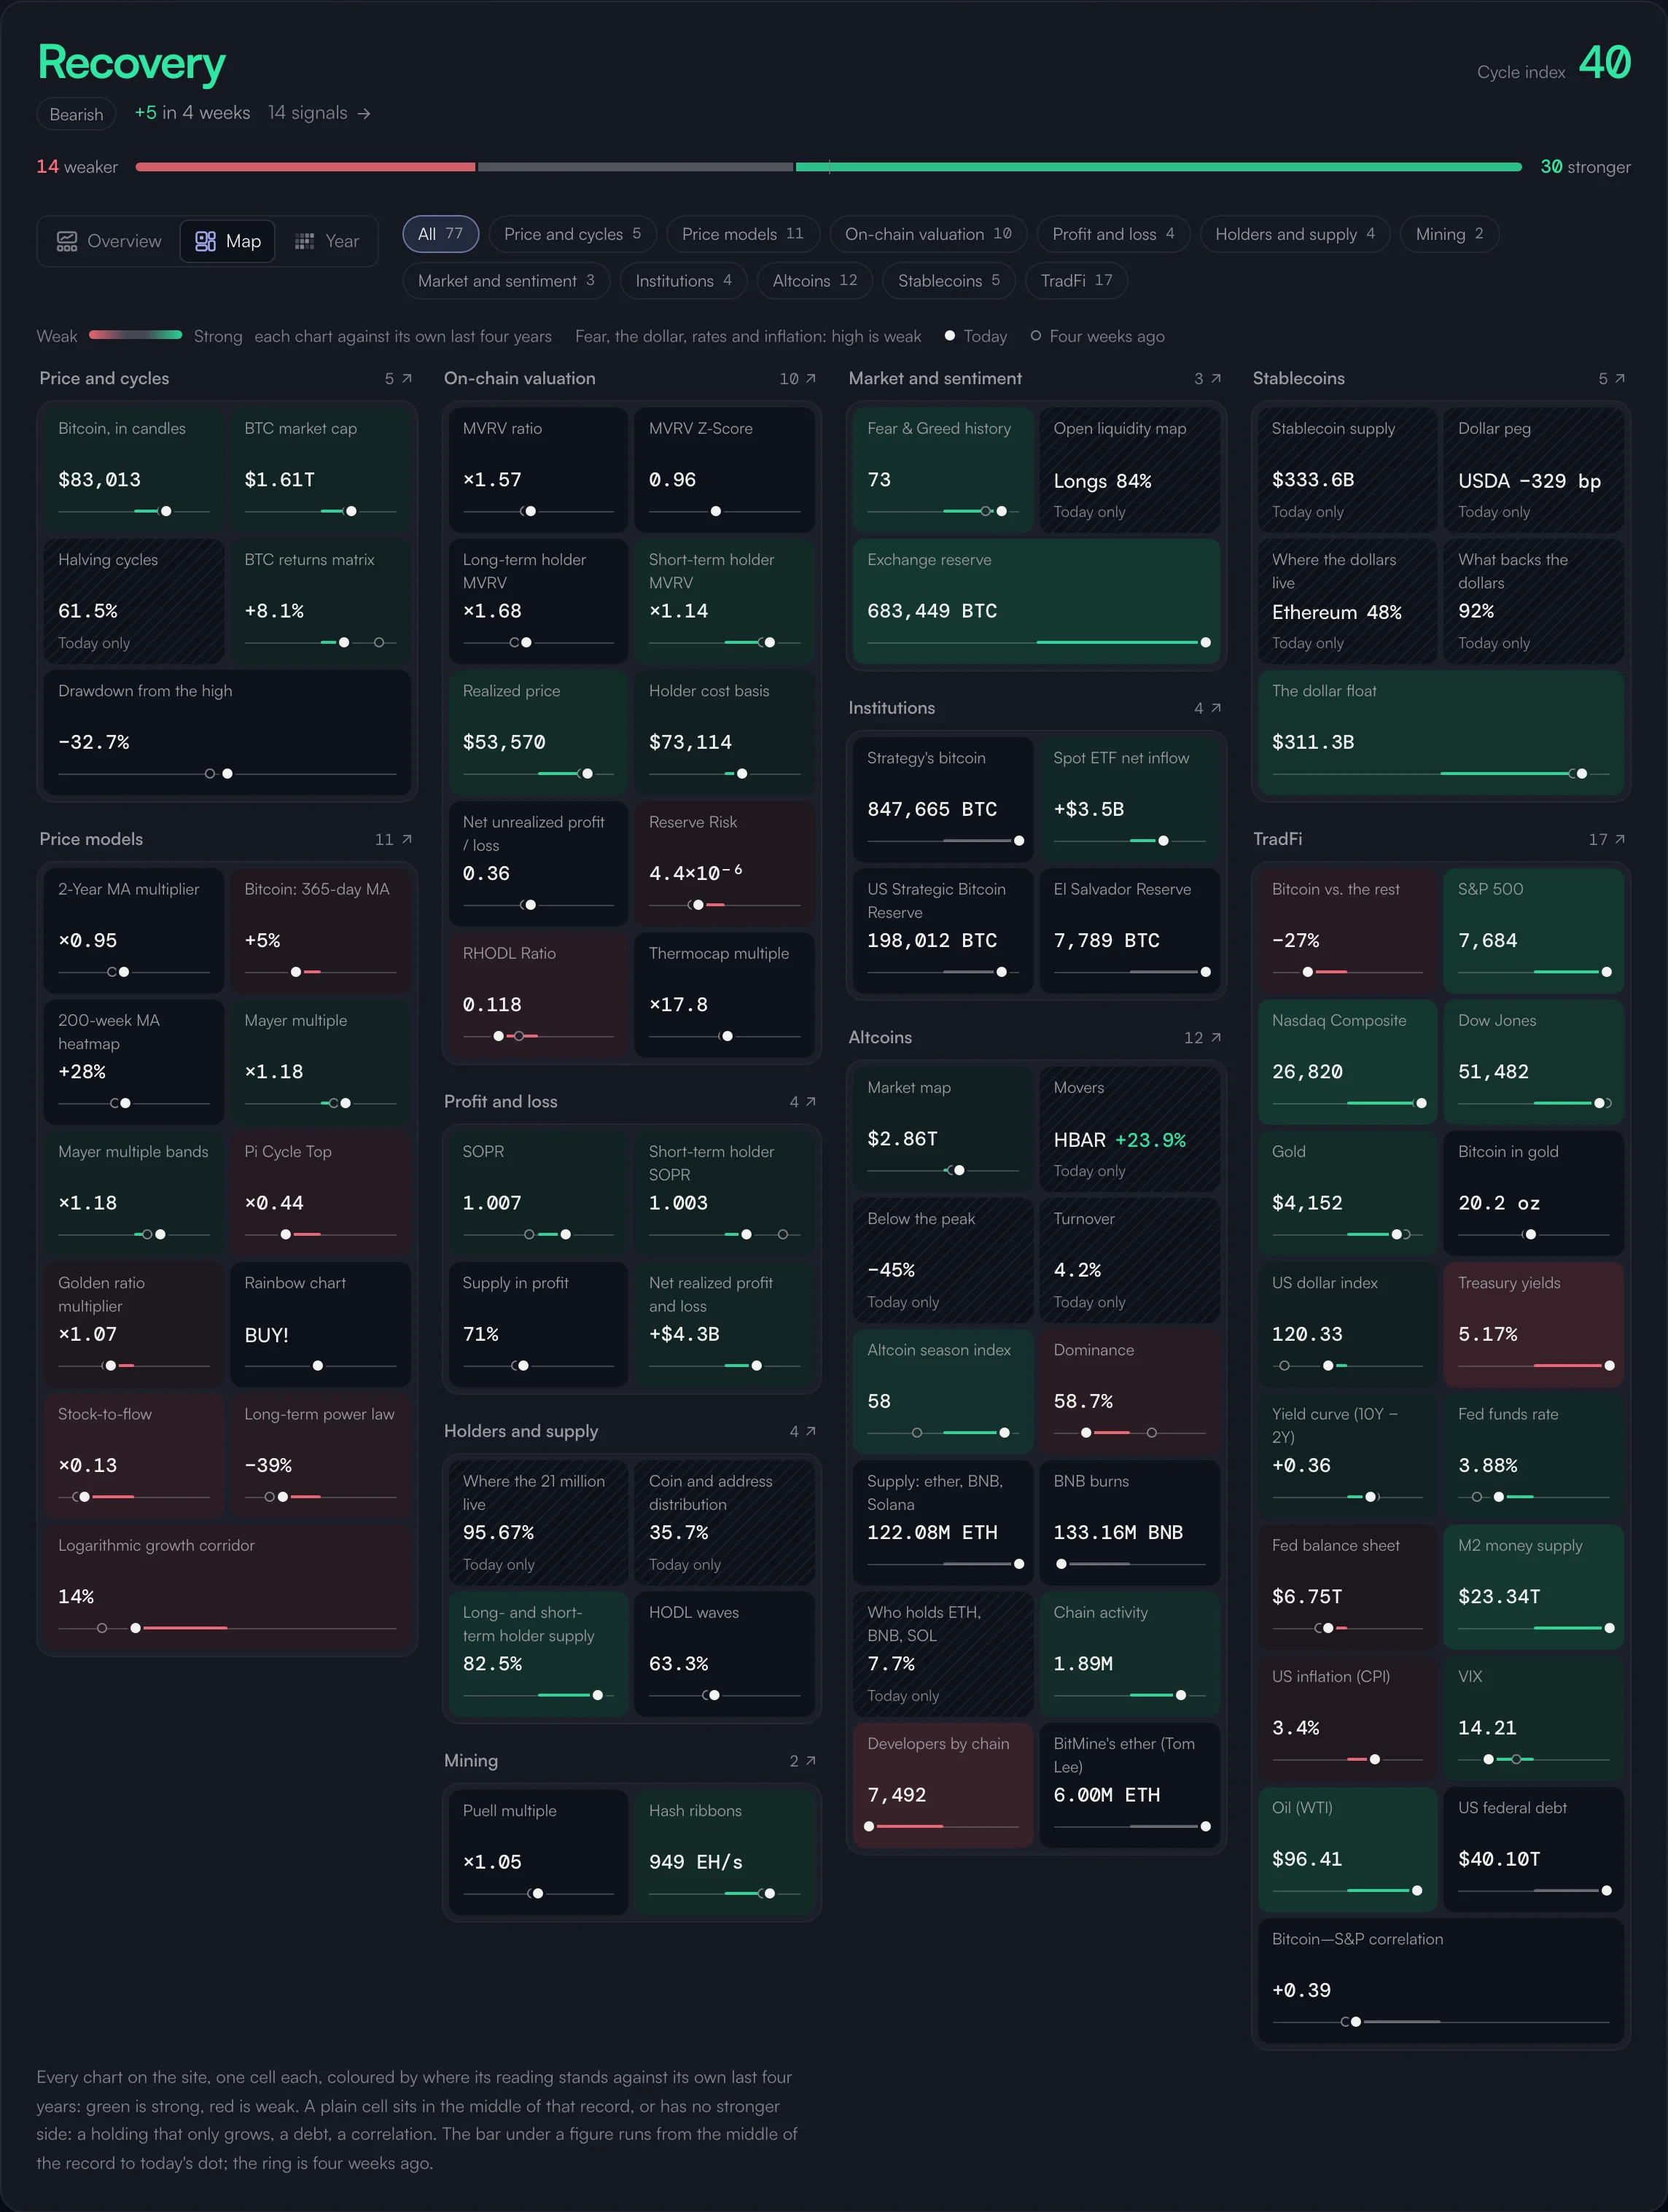
Every chart on the site as one cell, family by family, coloured by where today's reading stands against its own last four years.
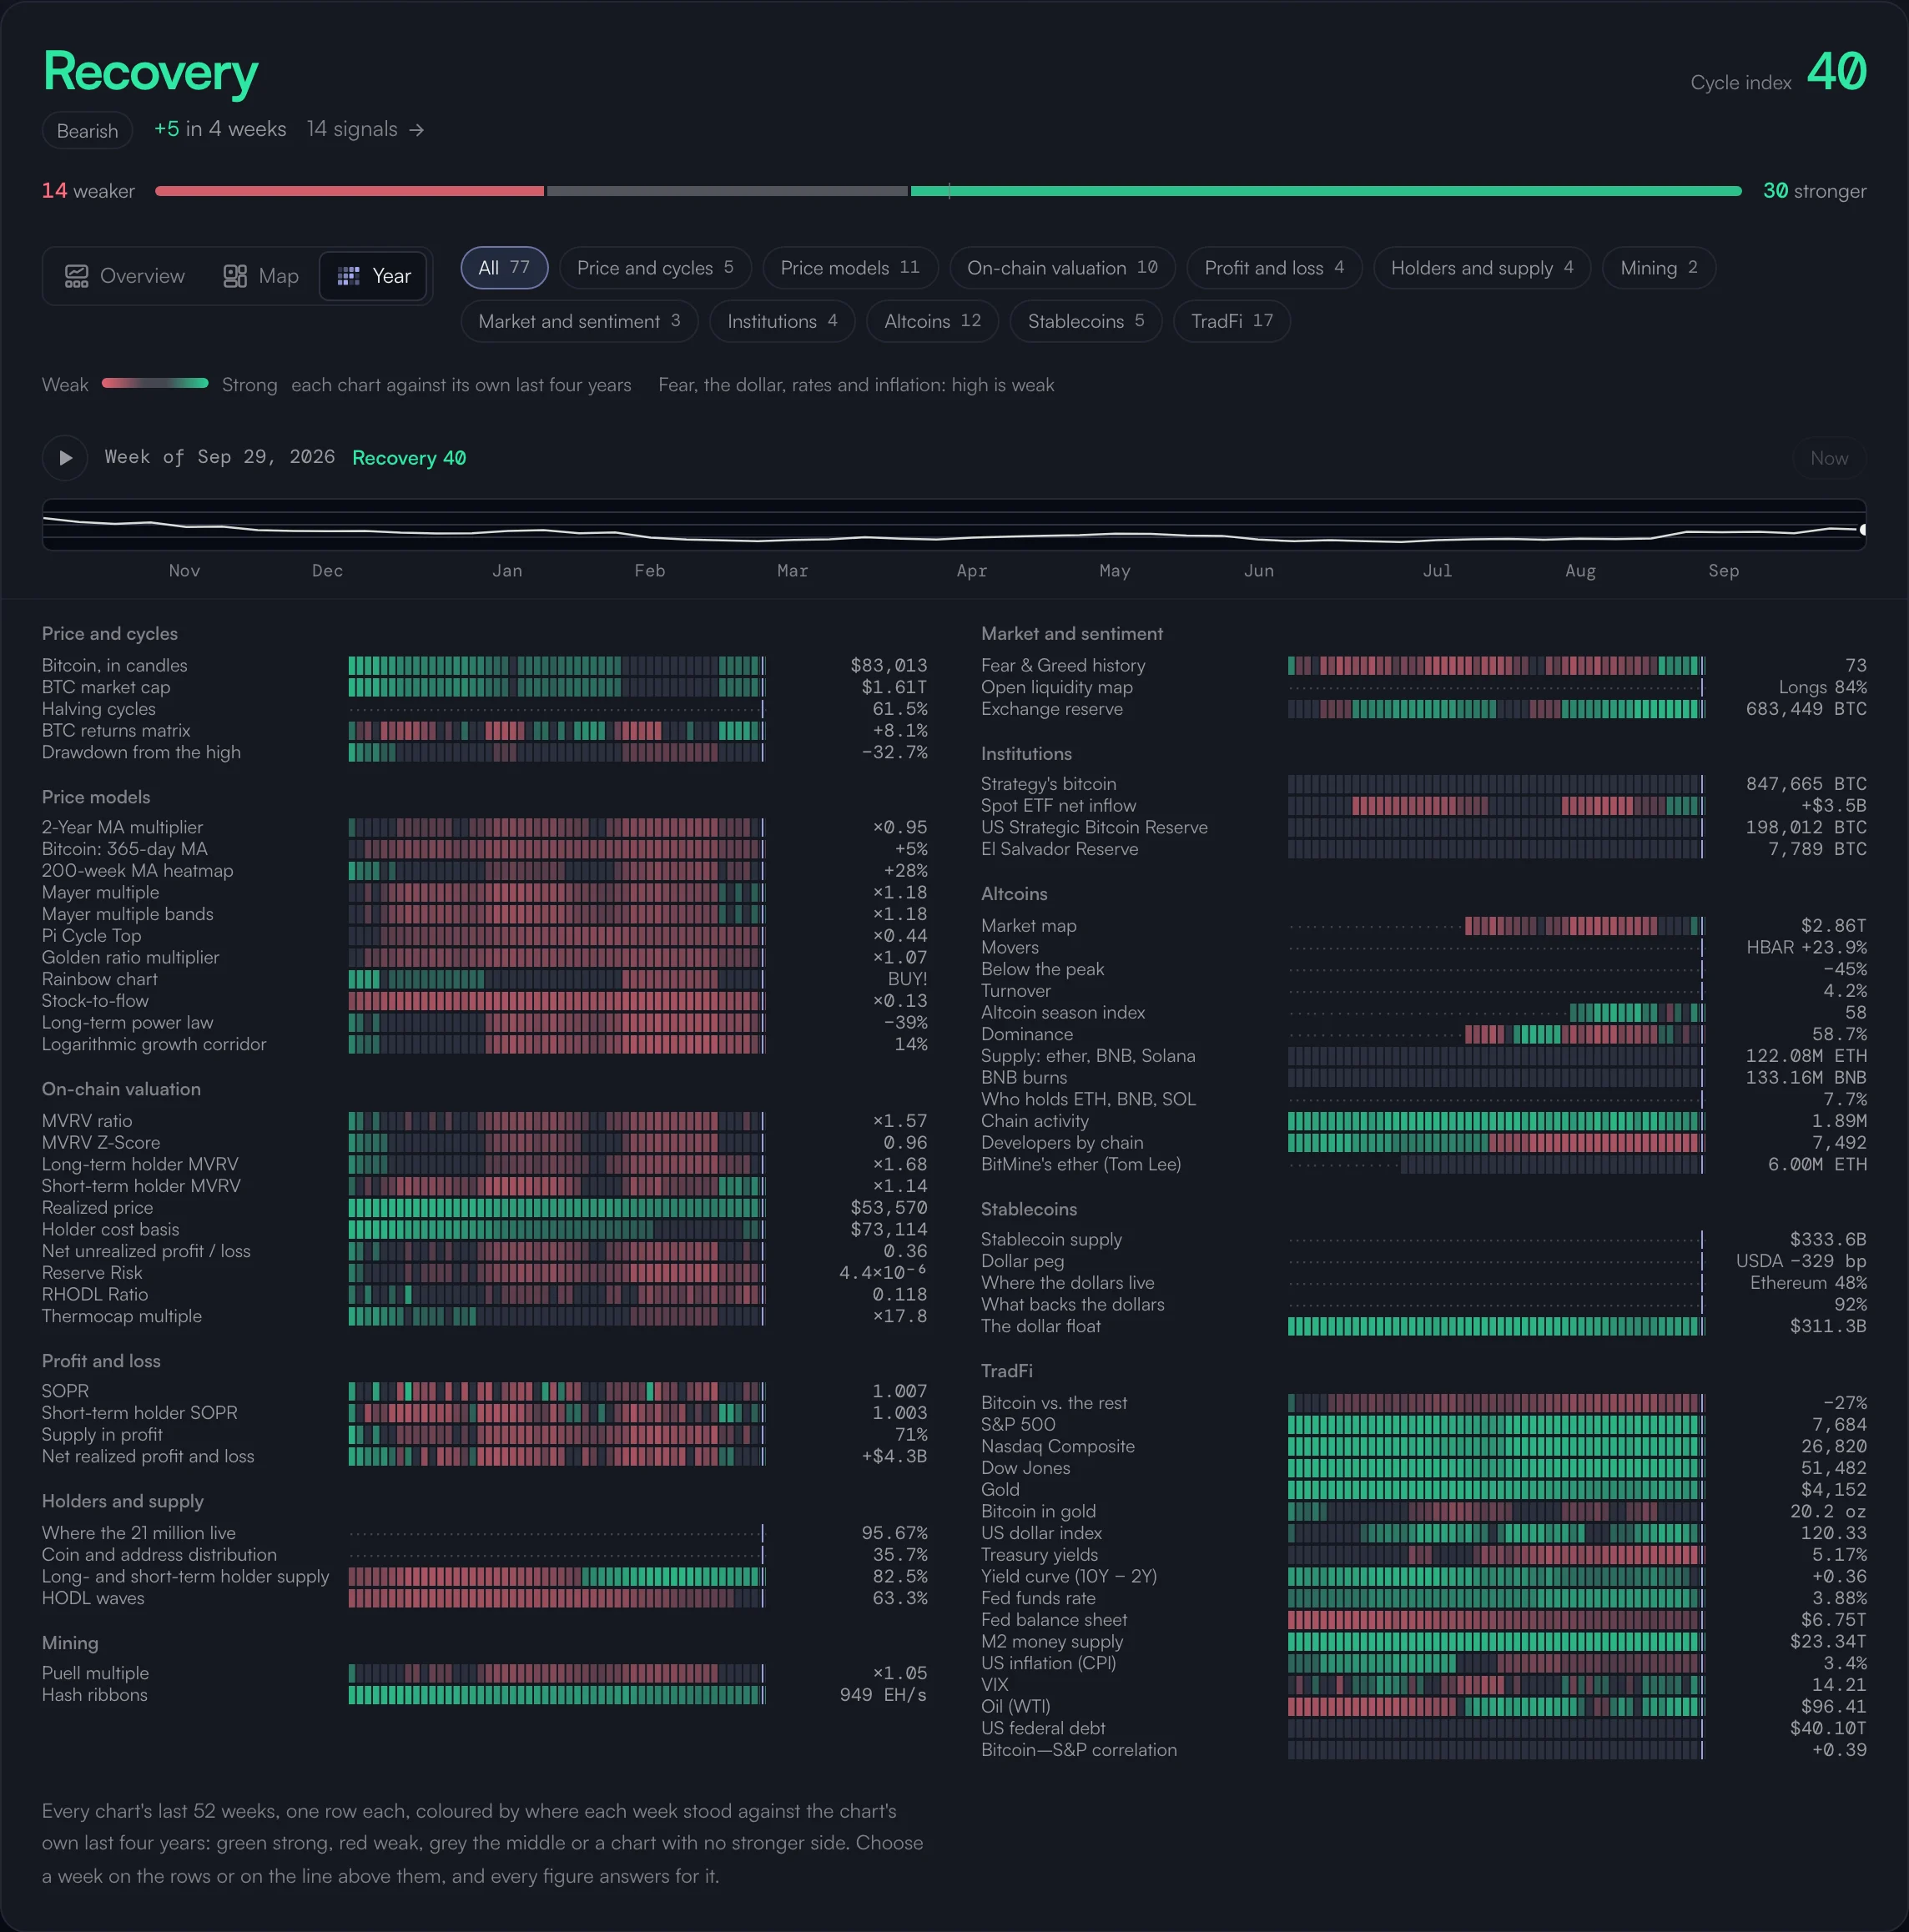
Every chart's last 52 weeks as one row. Choose a week, and every figure — and the verdict — answers for it.
On the wall
Every reading comes with its context: set against its own history, beside its own family, on its own clock.
Cycle metrics from on-chain data and from the price's own history, each scored 0–100 against its past and placed on a dial by its level and its four-week move.
A reading means little alone. Each cell says whether it is strong, weak or in the middle of its own last four years, and where it stood four weeks ago.
Each series arrives as numbers from a public feed and is computed and drawn on Perly's own frame — with hover, zoom, fullscreen and export on every chart.
The Foodchain turns the live book for bitcoin, ether, SOL and BNB into two armies of fish: resting orders hold their price, market orders swim in to bite.
The leading crypto publishers and the Tree of Alpha wire, filtered to Bitcoin, on one timeline — any period a click away.
The highs, the drawdowns and the halvings, and how far a single day can move — worked out from the same daily history as every chart.
Readings as the board showed them on 29 September 2026. The board itself is live.
Inside Perly Charts
Captured on charts.perly.io, in English, on the day this page was written.
01Signals
The cycle clock, with every metric's score and its four-week move beside it.
charts.perly.io/signals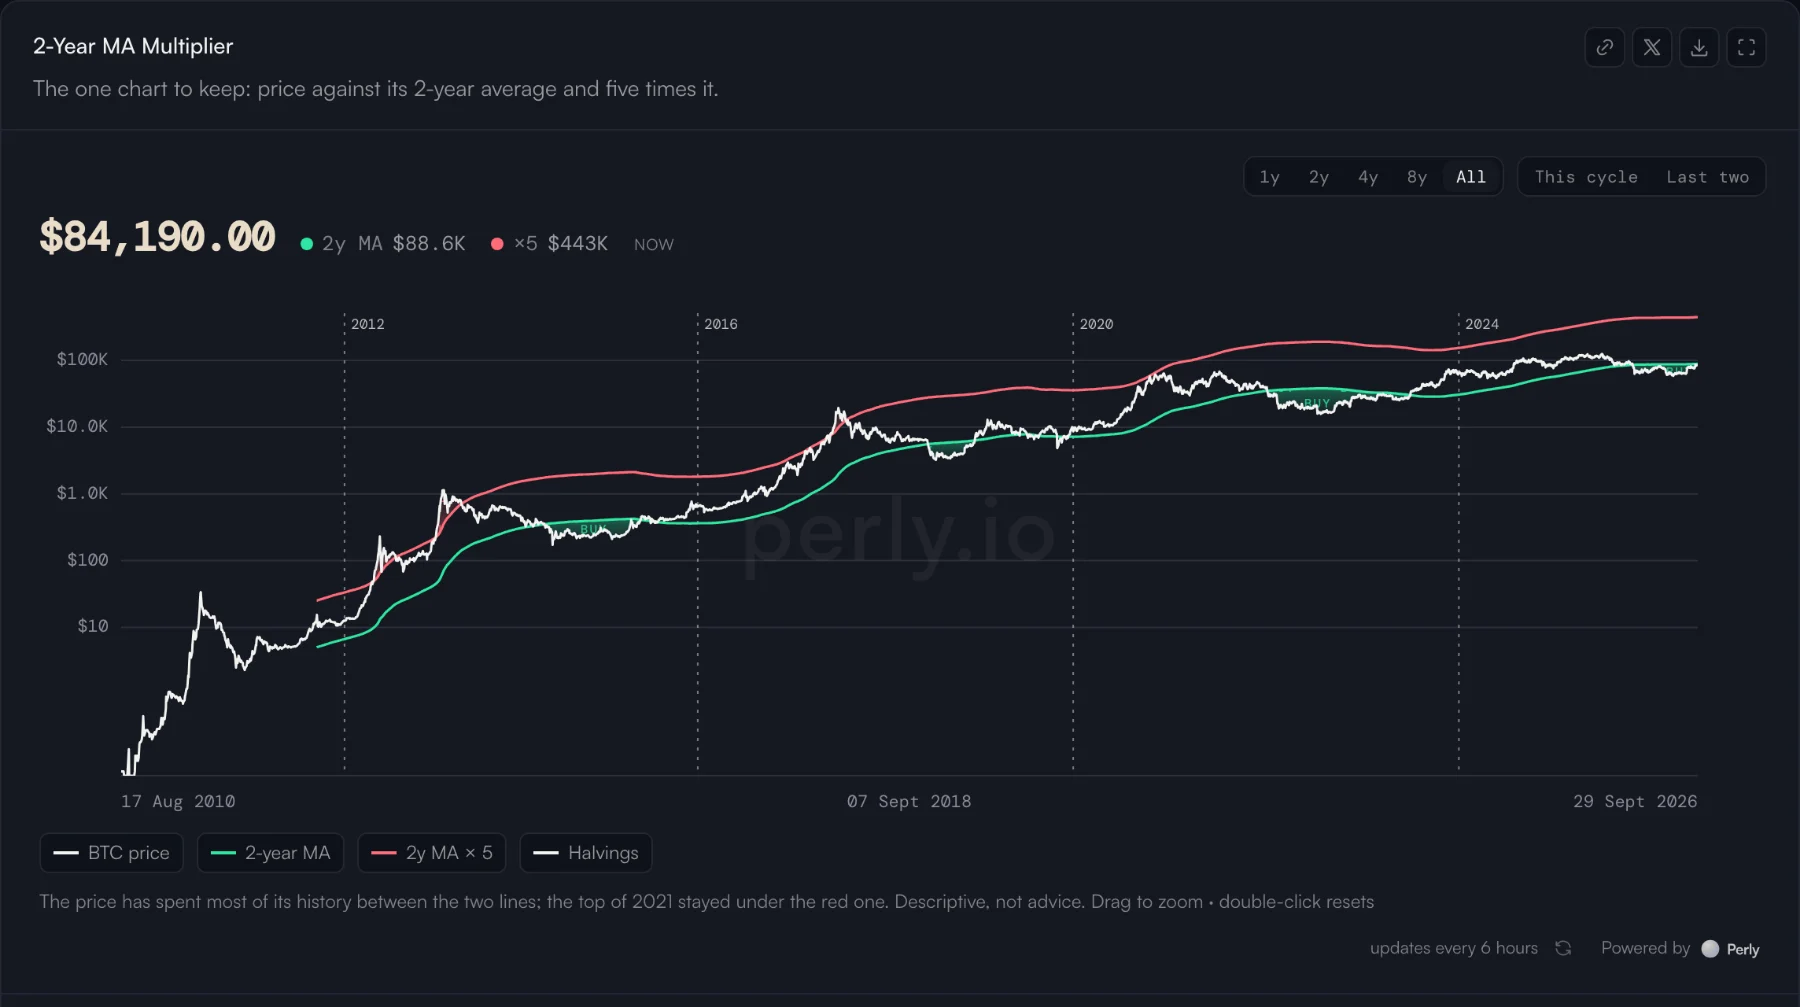
02A chart
The 2-Year MA Multiplier on a log scale, the halvings marked and the range a click away.
charts.perly.io/chart/two-year-ma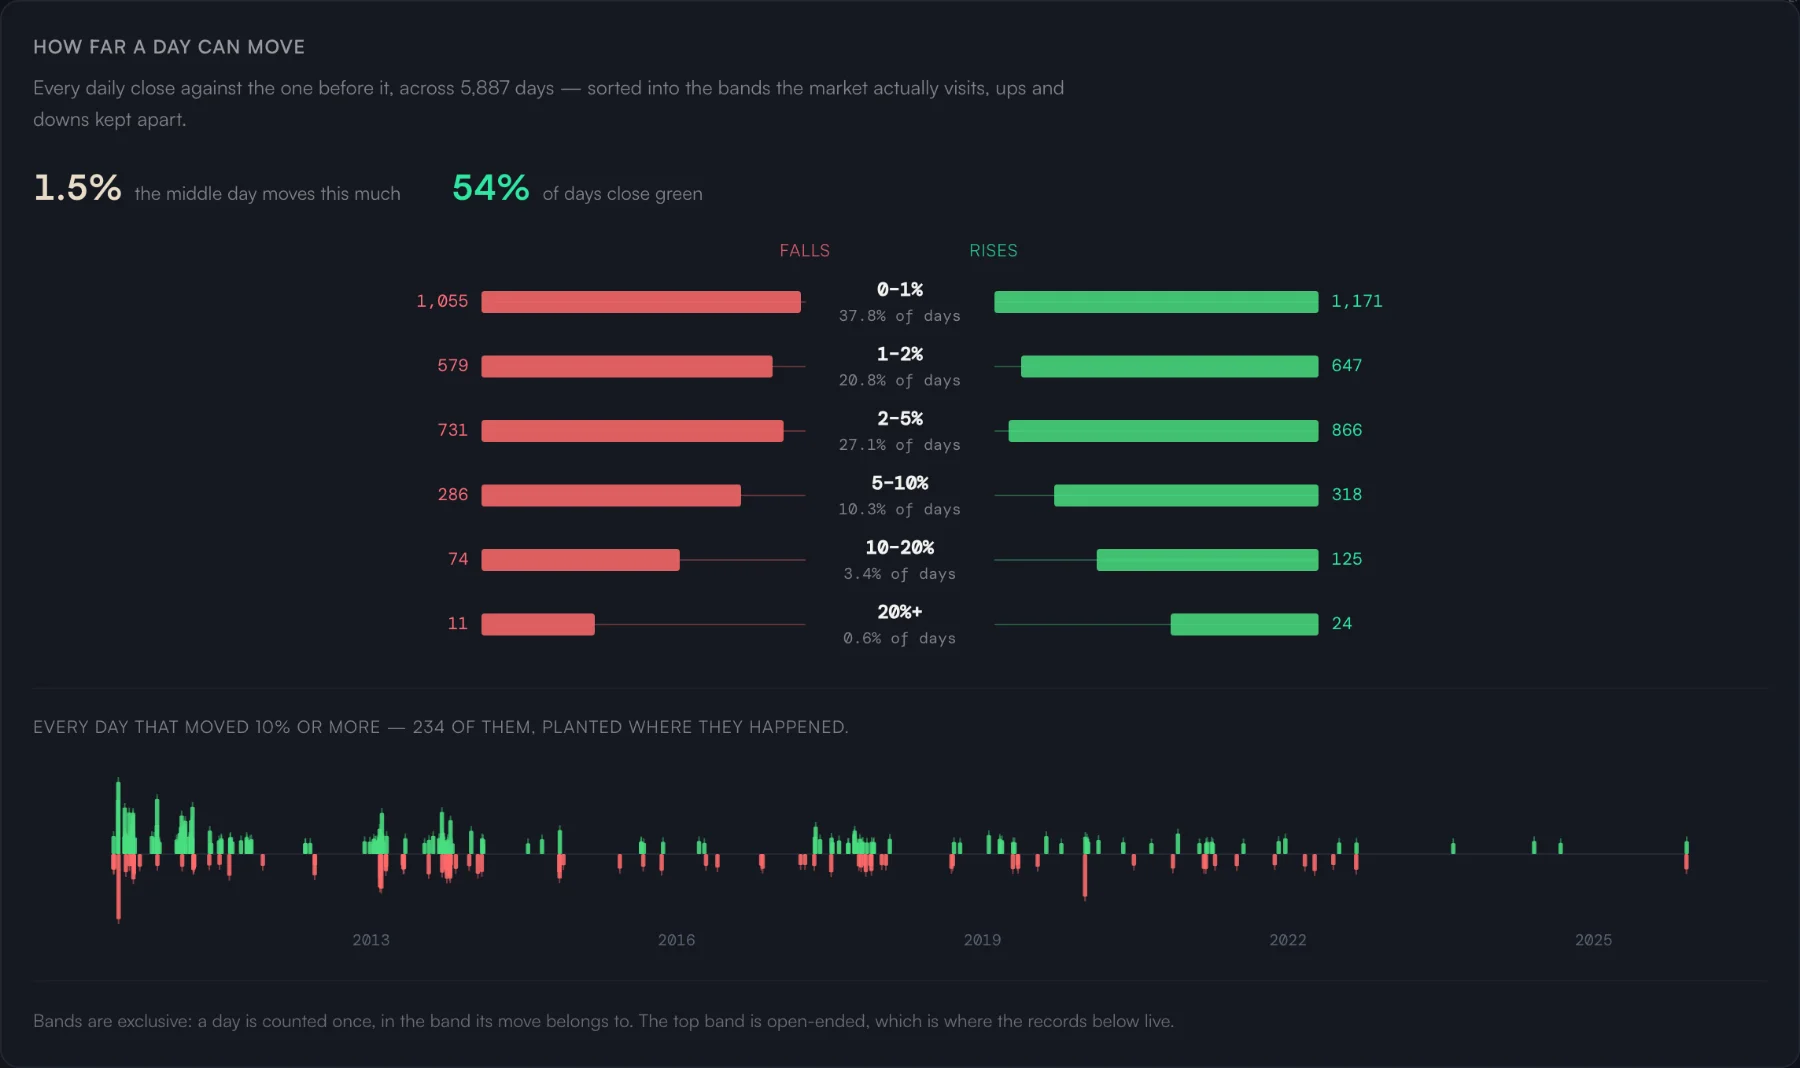
03History moments
Every daily close since 2010, sorted by how far the day moved.
charts.perly.io/history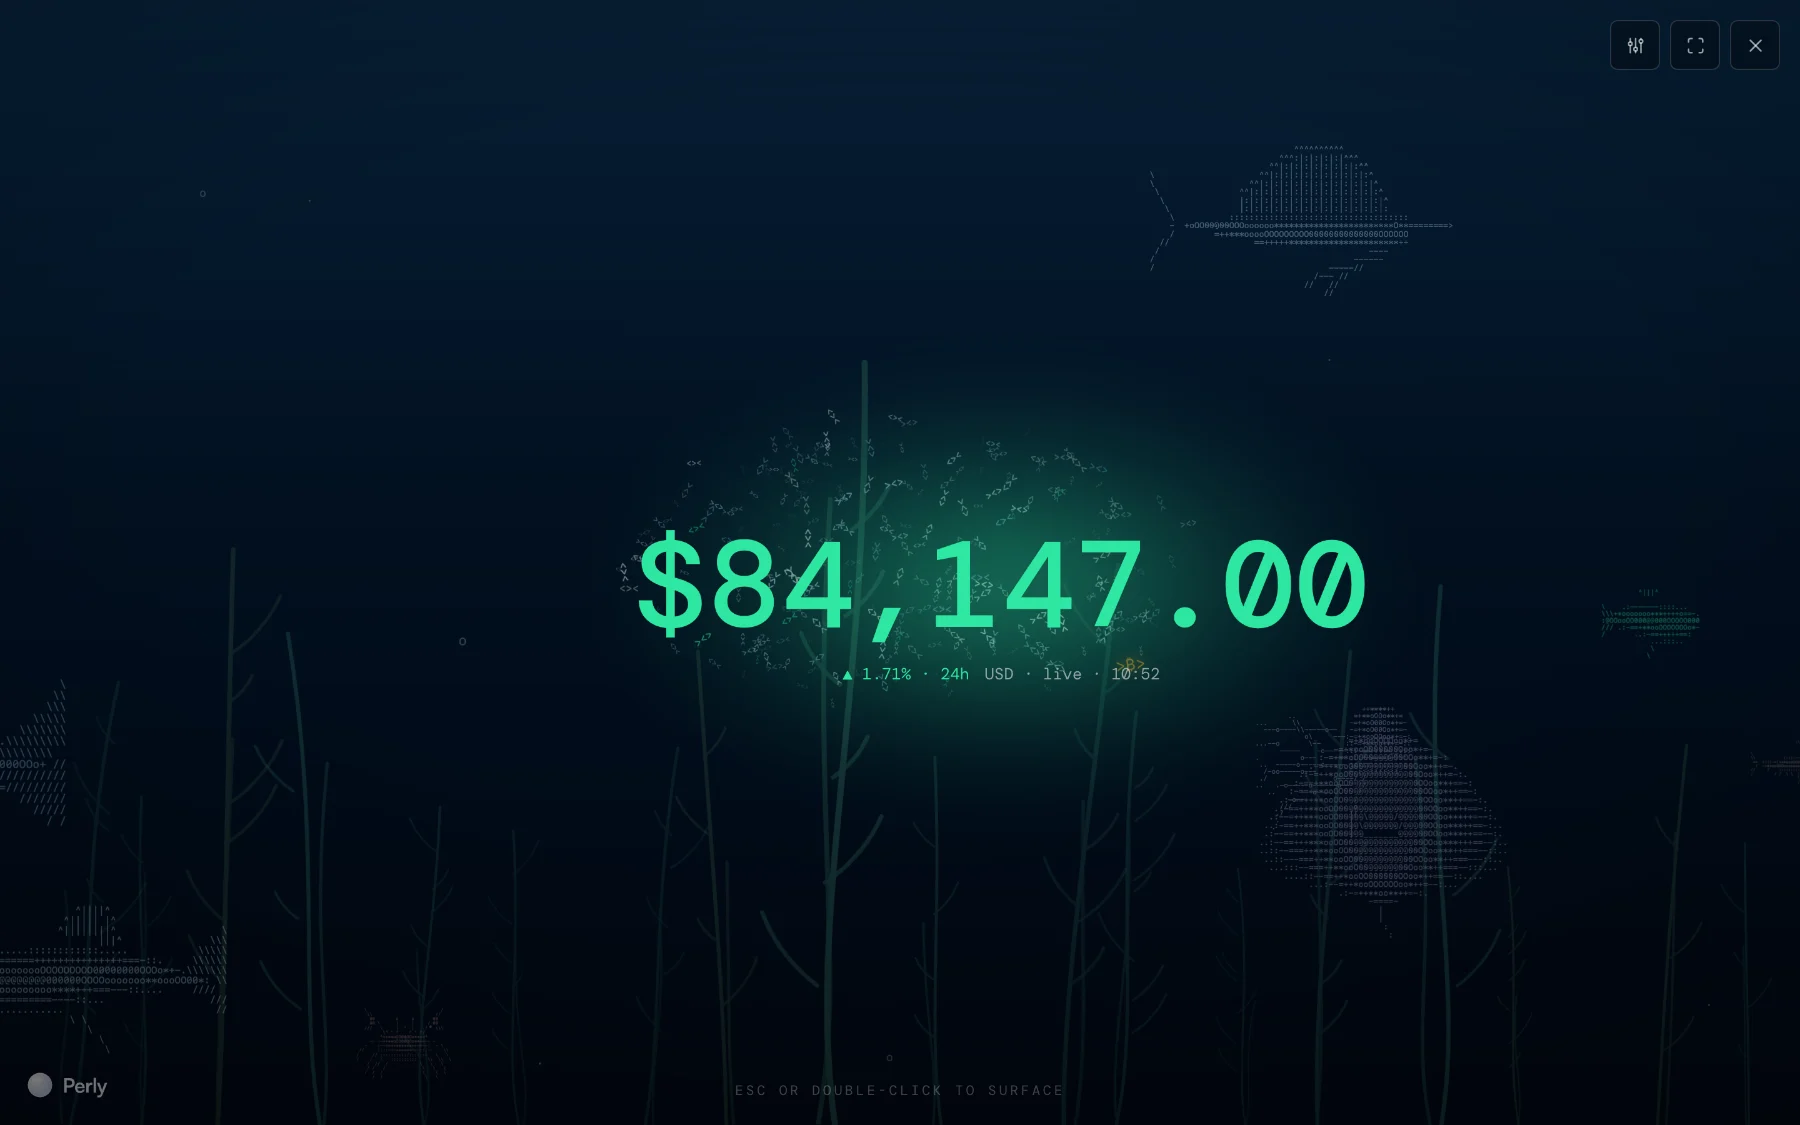
04The screensaver
The price, live, in an aquarium — for a second screen or a quiet evening.
charts.perly.io/screensaverOur numbers, our method
Computed here
Prices, on-chain series, macro data and filings arrive as raw numbers from public feeds — CoinGecko, CoinMarketCap, FRED, the US Treasury, SEC EDGAR, Bitview, mempool.space and others — and Perly computes and draws every series itself.
No hindsight
A past week is scored only against the weeks before it, so the history shows what the board would have said at the time.
Sources named
Every page credits the feeds its numbers came from, in the words their terms ask for.
Fresh through the day
The shelves are rebuilt every six hours, each card says how often its own data moves, and the Foodchain reads the exchanges live.
Not advice
The board reads the past; it does not forecast prices. A page that reads the market says so.
Your own position
Every chart page ends where your own bitcoin begins: the way into your own position, and an alert for the level you are watching — in Perly App.
Yes. Every chart, the signal board, the news wire and the Foodchain are free, and none of it asks for an account or an email.
From public feeds: CoinGecko and CoinMarketCap for prices, FRED and the US Treasury for macro data, SEC filings, Bitview for on-chain data, mempool.space and others. Perly computes and draws every series itself, and each page names its sources.
The shelves are rebuilt every six hours, and each chart says how often its own data updates. The Foodchain and the screensaver are live.
No. The board describes the past and does not forecast prices. What to do with it is always yours to decide.
Not yet. Perly Charts is open and still being built, and every page has a way to tell us what is wrong or missing.
Eighteen, among them Arabic, which reads right to left.
No account, no email, no paywall — just the market, drawn from its own numbers.
Or track your own position in Perly App